Every Friday afternoon (or in the worst case Sunday evening) someone at the company is pulling numbers. Revenue and receivables from Pohoda. Open deals and conversion rates from the CRM. Order count and average basket value from Shoptet. Then it all goes into a spreadsheet, gets compared to last week, and formatted into a presentable report. Monday's meeting starts at nine.
The work nobody wants to do
The problem is not that the numbers are unavailable. They are there. Every system has them. The problem is that they live in five different places and none of those places talk to each other. Every week the whole cycle repeats: log in, export, copy, format, verify, send.
Estimates suggest managers at small and mid-sized companies spend three to five hours a week collecting and preparing data for internal reports. Those are hours that could go toward understanding what the numbers mean, not toward getting them in one place.
Every Monday report was formatted slightly differently depending on who had done it the week before. We never knew if we were comparing apples to apples.
— Sales director, manufacturing company, 45 employees, illustrative scene
What "writes itself" actually means
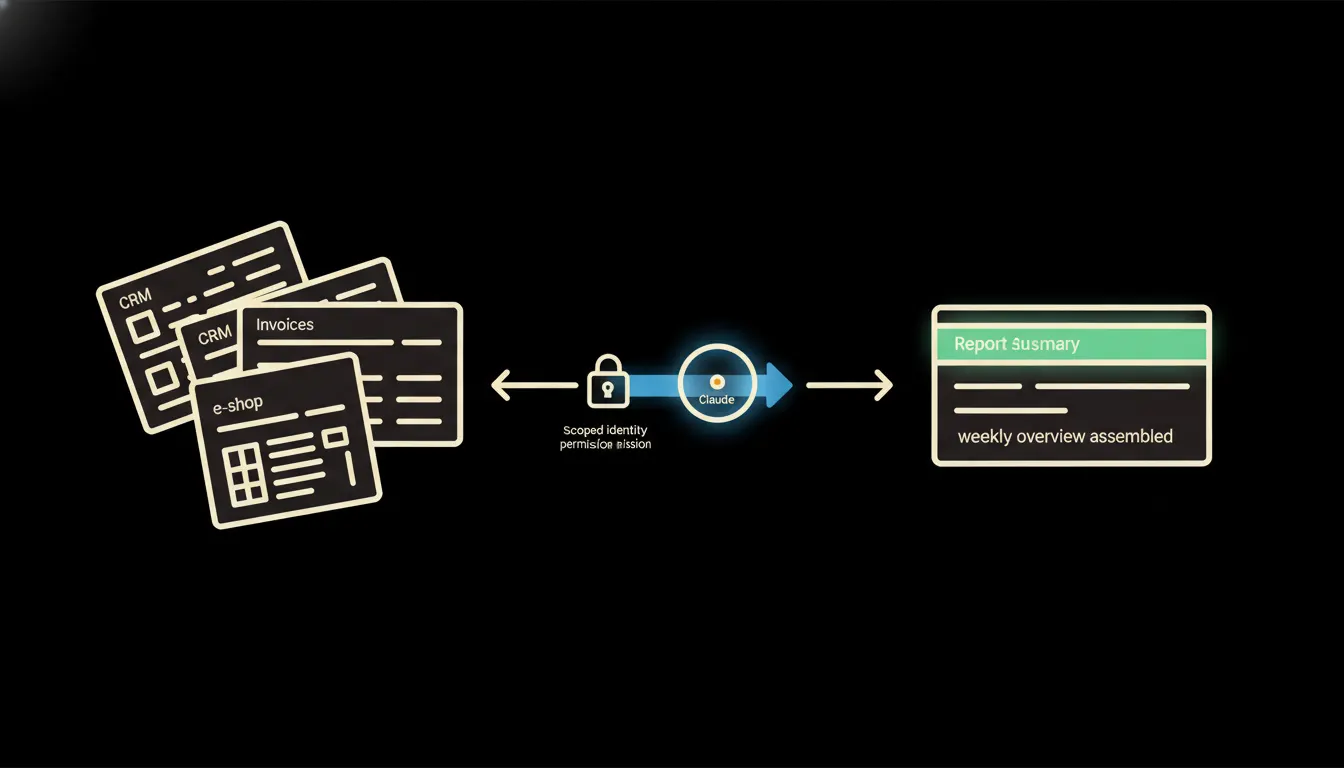
Claude does not access data like a shared pool. It accesses data as you, with your identity and your permissions. Each MCP server is a small, focused bridge between Claude and one specific system: one bridge for Pohoda, one for the CRM, one for Shoptet. Claude reads through them exactly what a logged-in person with that role would see, nothing more.
The result is that on Monday morning the manager receives a report assembled directly from live data. The same structure every week, always current numbers, always a consistent format. Nobody copied anything.
Concretely: Pohoda, Shoptet, and a CRM
A typical Czech company with an e-shop has revenue data in Pohoda, order data in Shoptet, and pipeline data in a CRM such as HubSpot or Pipedrive. Three systems, three sets of credentials, three different export formats. With an MCP server for each one, Claude assembles the weekly overview on its own: it reads revenue from Pohoda for the last seven days, compares it to the previous week, adds order count and average basket from Shoptet, and pulls new leads and closed deals from the CRM.
- Reads current revenue and receivables from Pohoda, no manual export.
- Compares order count and average basket value from Shoptet against the prior period.
- Summarises the pipeline from the CRM: new leads, deals in progress, closed contracts.
- Assembles the overview in the format management actually reads: concise, structured, with notable variances highlighted.
- Sends the report to Slack or email every Monday at 7:30, without anyone touching it.
A smaller company where one person handled both sales and financial reporting every Friday (typically a controller or a director's assistant) could illustratively save three to four hours a week this way. Those hours can go toward analysing what the numbers mean rather than gathering them.
What AI reporting will not do and why that's a good thing
Claude does not decide. It assembles an overview: what sold, what went unpaid, where the pipeline is stalling. The conclusion about what those numbers mean for next week is always made by a person. Why did revenue drop? Should a promotion go out? Who needs a call? Those are decisions that require context, relationships, and accountability. No automated report replaces them.
And that is precisely why this approach can be trusted. The boundary is clear and it does not shift. The report is input, not conclusion.
What it would take
For each system you want included in the report, one MCP server is set up. It runs on your infrastructure, accesses data with the credentials of a specific user, and sends nothing outside your environment. No data leaves your perimeter. Setup takes days, not months, and the report template is configured once, then just filled with current numbers.
What's left
The model is not the bottleneck. Claude can read, sort, and format. The bottleneck is the gap between Claude and the data your company already holds today: in Pohoda, in the CRM, in the e-shop. That gap is what we close.
Write to us. A short call is enough to map out which data someone is currently copying by hand and where it makes sense to start. Every Monday report can be ready before you walk through the door.